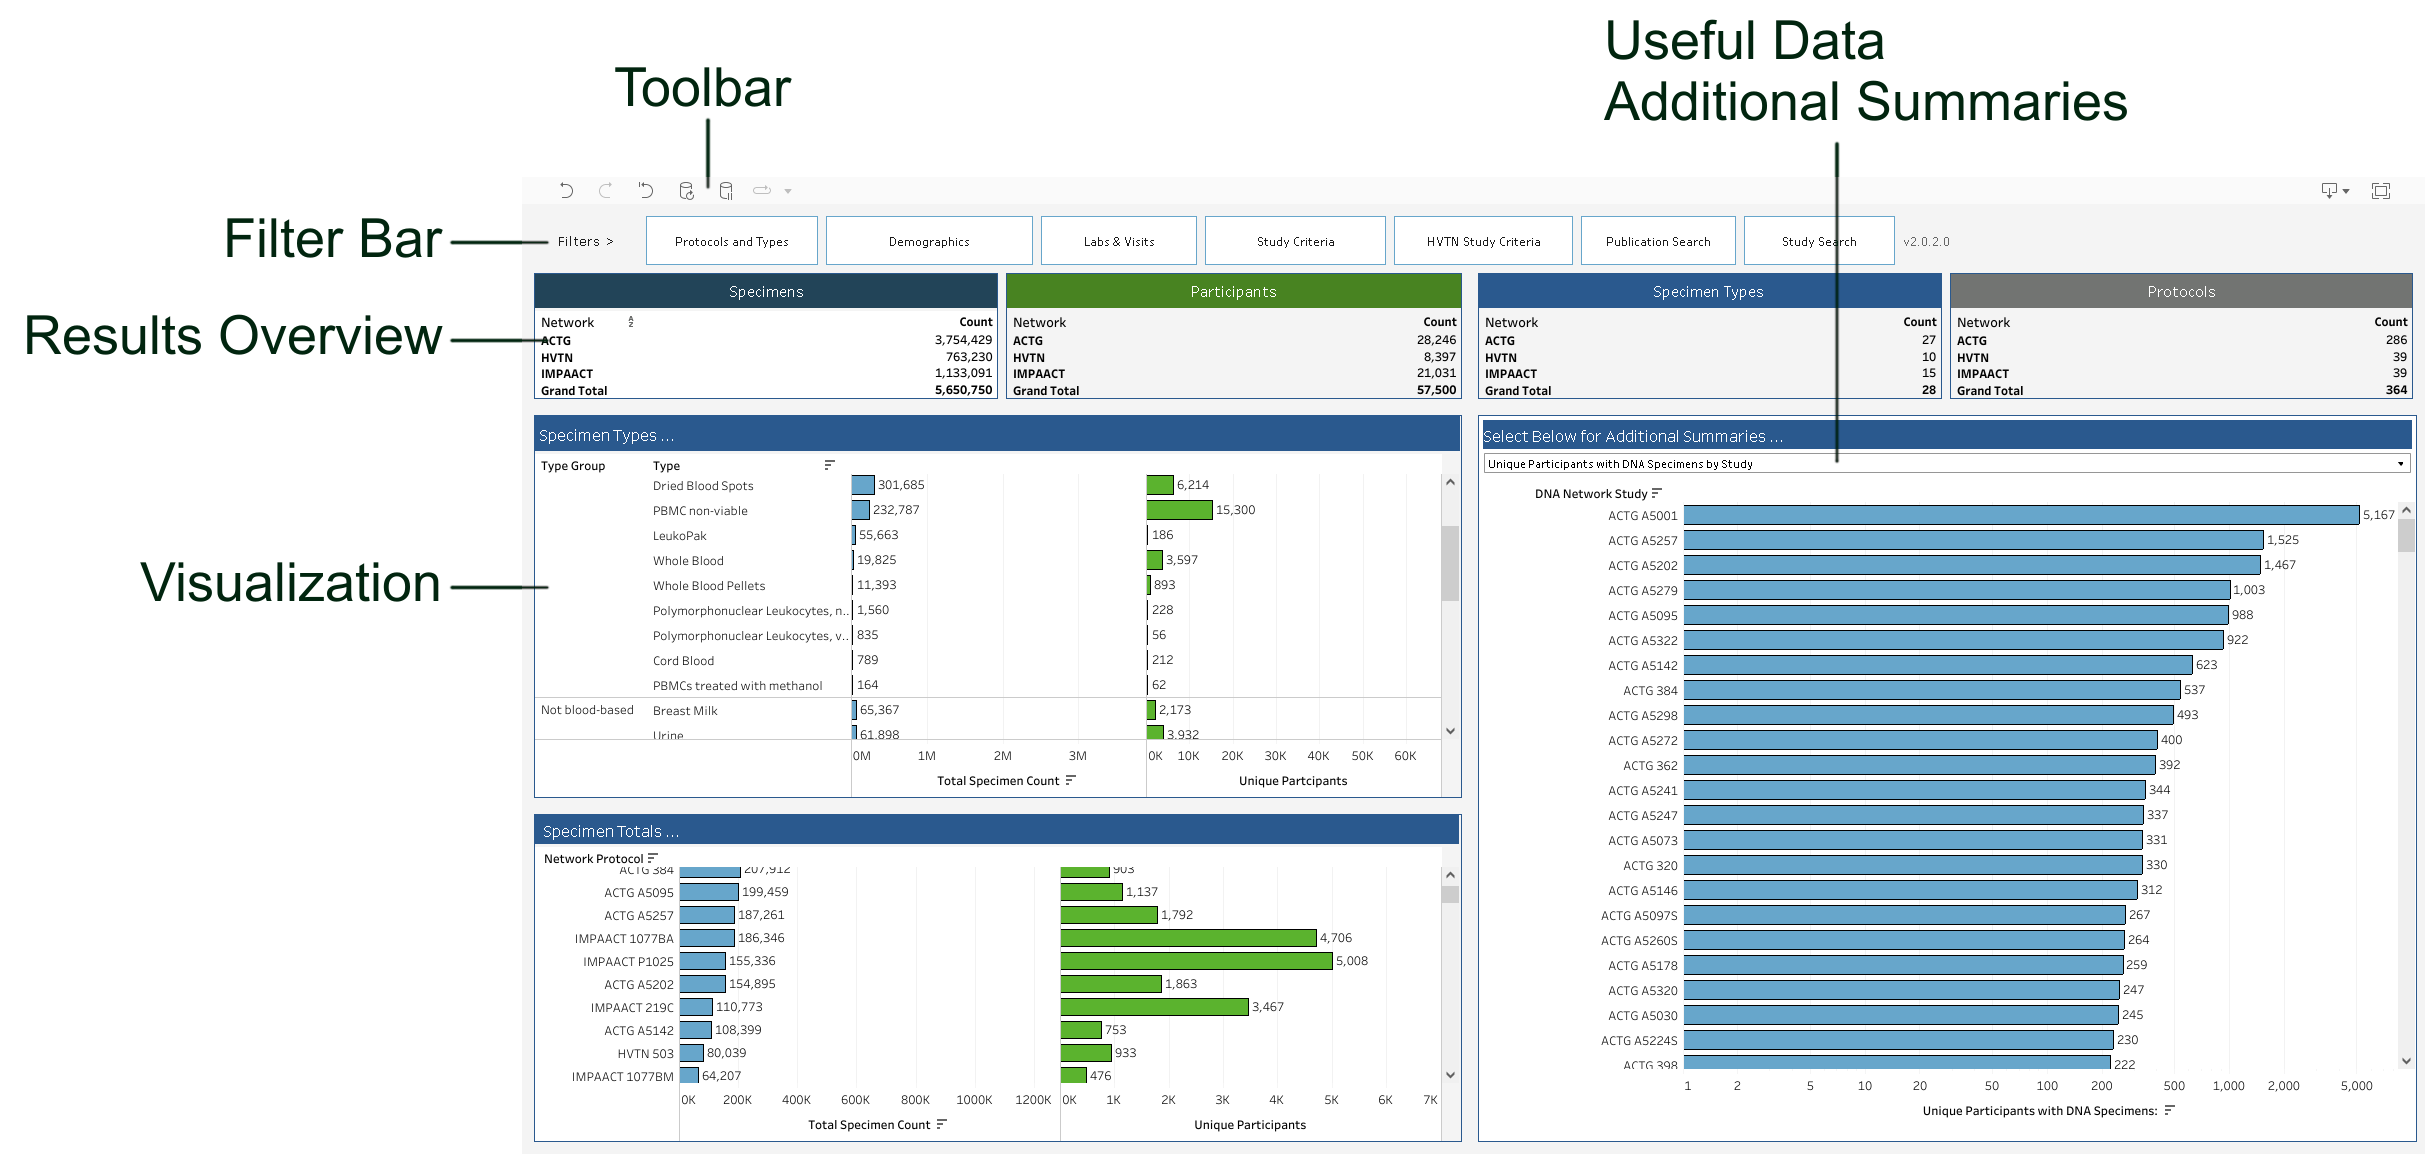
Overview
The search tool shows aggregate, coded data for closed studies for clinical trial networks participating in SpecimenRepository.org.
Note: For ACTG and IMPAACT studies, the Specimen Inventory Report Utility (SIRU) allows searching active studies for authorized users. A Frontier Science ePortal account is required.
Features:
- See the number of specimens and unique participant data available based on study, demographic, and visit interests.
- View details for the studies for which the specimens were collected
- Find publications associated with studies
- View additional summaries for data items of interest

The toolbar contains the following features:
| Toolbar Button | Description |
|---|---|
| Undo my last action | Take back the last action performed (including opening and closing filters) |
| Redo my last action | Restore the last action from undo |
| Reset view | Restore the visualization to its original state, clearing all filters |
| Refresh data in this view | Ensure that the visualization data is up-to-date (not typically needed as the visualization will auto refresh as it is used) |
| Pause data queries while applying actions | Temporarily disable auto refreshing data; see Pausing Auto Refresh |
| Complete updates made while paused | Re-enable auto refreshing data; see Pausing Auto Refresh |
| Choose a format to Download | Download data from the visualization in various formats |
| See this in Fullscreen | Open the visualization in fullscreen mode |
Interacting with the search visualization
The initial state of the search visualization displays all specimen and participant counts without any filtering applied.
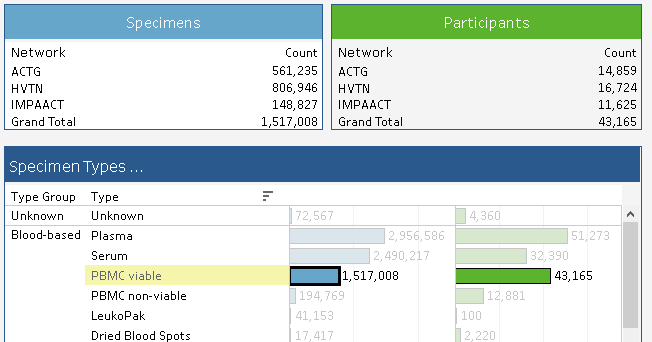
Click on any data item in the visualization to filter by that item. For example, in the Specimen Types pane, click PBMC viable to filter all data by that specimen type. All data in the search visualization would now only show data for PBMC viable specimens (e.g. the list of Specimen Totals by Network Protocol now only includes PBMC viable specimens).
(Note: The ... in the title bar of a section of the visualization indicates that you can filter by clicking a data item in that section.)

Basic Filtering
-
In the Filters section, click to open any filters of interest:
Filter Category Description Protocols and Types Clinical trial network, specific studies, specimen types Demographics Information about the participant, such as sex, race, and age. Labs & Visits Information about the visit and laboratory results, such as type, year, and viral load Study Criteria Study criteria such as HIV status of participants on the study HVTN Study Criteria Product for vaccine-related studies Note: To switch between any criteria, click the Hide button in the filters bar to avoid opening multiple filter windows within the search visualization.
-
Select filter criteria of interest.
Note: Filters are applied immediately after selecting but it may take a few seconds for the search visualization to reload the data.
- Close the criteria window by clicking the Hide button in the filters bar.
Pausing Auto Refresh
By default, when a filter is changed, the visualization will automatically refresh. If you want to apply multiple filters at once, you can disable the auto refresh behavior.
In the toolbar, click Pause data queries while applying actions. While paused, the visualization will not be updated. You can apply filters quicker while auto refreshing is paused.
To start refreshing the visualization again, click Complete updates made while paused.
Note: While paused, the Refresh data in this view button will not refresh the visualization data. You must click Complete updates made while paused to update the visualization data.
Downloading Data
After searching, you can download data from the visualization. In the toolbar, click Choose a Format to Download.
| Format | Details |
|---|---|
| Image | Export entire visualization as a PNG file. |
| Crosstab | Export the selected data to a cross tabulation format. |
| Export entire visualization to PDF with specified dimensions provided. | |
| PowerPoint | Export selected sections of the visualization as individual PowerPoint slides. |
Additional Summaries
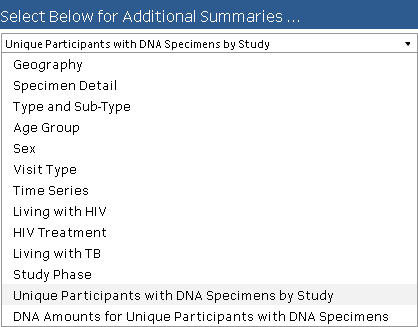
The Additional Summaries pane has multiple visualizations to switch between. Under Select below for additional summaries, click the menu below to change between visualizations.
Tip: The Additional Summaries provides data not shown in other visualizations, such as specimens by study phase and number of participants with DNA specimens. Be sure to review these summaries for additional helpful data.

DNA Repository Details
Information on available DNA specimens for human genetic testing can be found under Additional Summaries. Select either Unique Participants with DNA Specimens by Study or DNA Amounts for Unique Participants with DNA Specimens to see what is available based on your selected search criteria.
Searching Publications
-
In the filter bar, click Publication Search.
-
(Optional) Use the search terms filters to limit the number of studies in the Publication Details list.
Tip: Some filters that are applied on the Protocols and Types tab are also applied to the list of publications. Click Protocols and Types and select a network or network protocol to filter the list of publications.
-
To select a publication in the Publication Details list, click the publication.
-
Hover over the selected study.
-
Do one of the following:
-
To view the publication on PubMed, click Click View on PubMed (opens in new window),
-
To filter the visualization to only show data from this study, click Filter Dashboard on This Network / Protocol
-
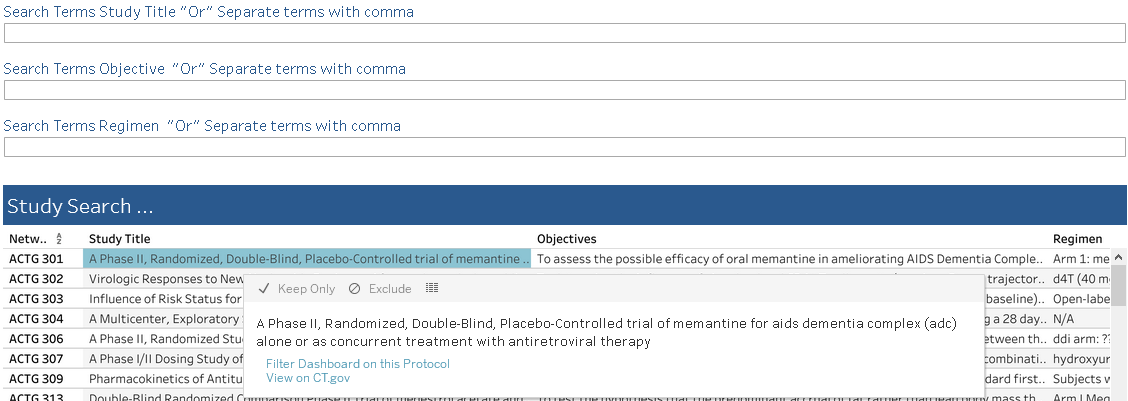
Searching Studies
-
In the filter bar, click Study Search.
-
(Optional) Use the search terms filters to limit the number of studies in the Study Search list.
Tip: Some filters that are applied on the Protocols and Types tab are also applied to the list of studies. Click Protocols and Types and select a network or network protocol to filter the list of studies.
-
To select a study in the Study Search list, click the study.
-
Hover over the selected study.

The Study Search filter -
Do one of the following:
-
To view the study on ClinicalTrials.gov, click View on CT.gov (opens in new window)
-
To filter the visualization to only show data from this study, click Filter Dashboard on This Protocol
-
-
To return to the dashboard, click Hide Study Search.
To stop filtering the dashboard by study, click the Reset View button in the visualization toolbar.